
Xcode debugging 101 — debugger explained
Every developer, regardless of their skill level or the type of current task, is constantly in a familiar cycle: we write code, run it, and debug. The number of iterations may vary, but we do this multiple times daily.
According to some studies, we spend up to 60% of our time on debugging – and this is an average value, for some, especially for novice developers, it may be even more. This article aims to reduce this time and make the debugging process more efficient and enjoyable.
Example
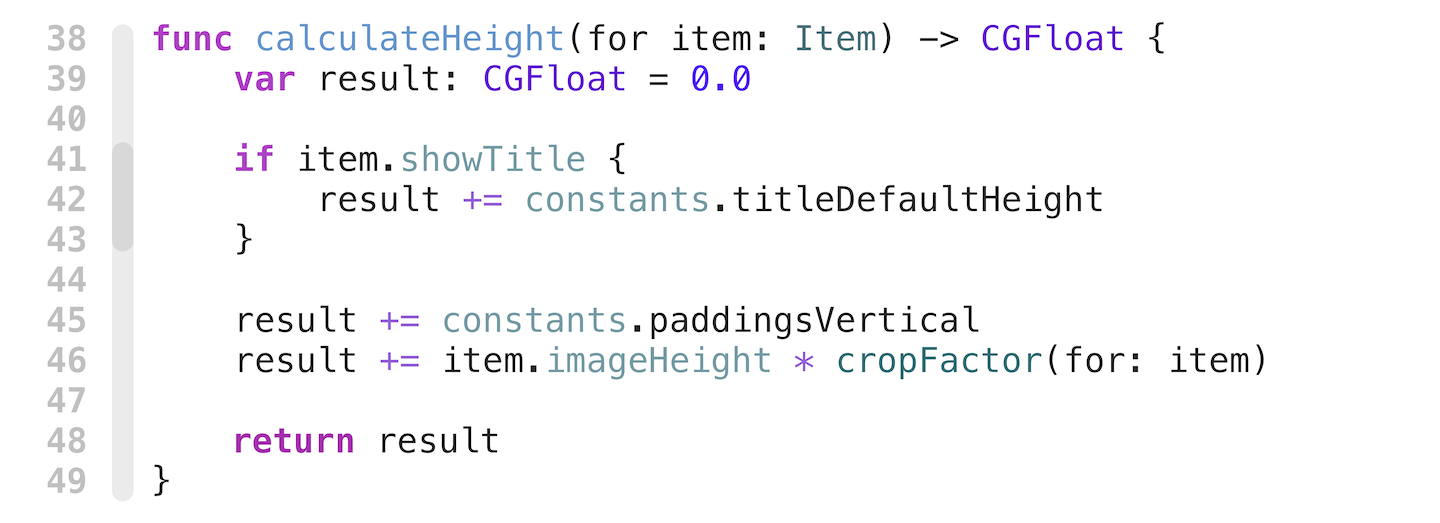
Let’s take a look at the process from the inside. I’ve provided a somewhat unusual example, but it’s closely related to our daily routine and describes most cases quite well. This code calculates the height for a table view cell: the height depends on certain constants and other functions. Let’s assume there’s a bug where the height is calculated incorrectly, and our task is to study this function and fix it.
The first thing that comes to mind is to use `print` for debugging to check the value of the `showTitle` flag at the calculation moment.
We run the project – imagine that it’s big, monolithic, and (here you don’t need your imagination anymore) Xcode is not perfect. Most often, we encounter a familiar situation: we add one line and wait several minutes for compilation. -- Aaand it’s time for Twitter or TikTok (depending on whether you know ObjC or not 😁 ), and a couple of minutes of compilation turn into 20 --. Besides building and running, we also need to reproduce the conditions, reach the desired screen, follow some steps, and only then check the output of the freshly added print.
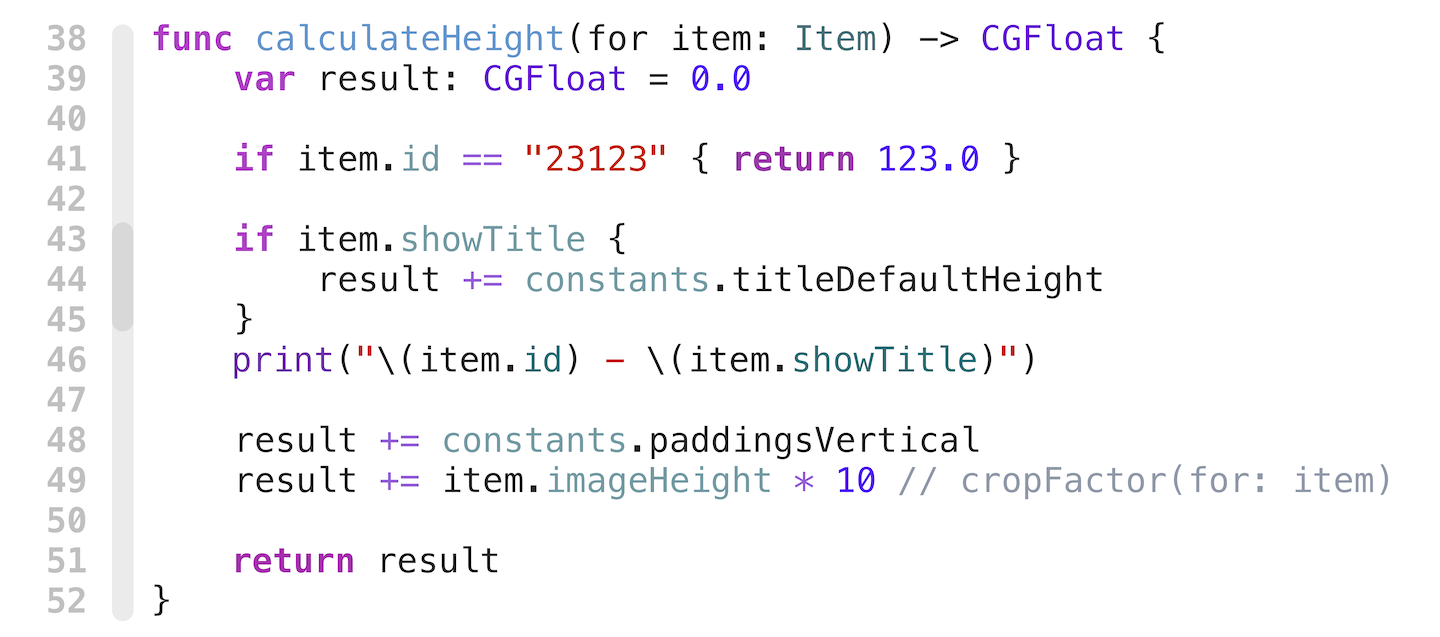
And it’s good if the hunch is correct, but as it usually happens, it’s not easy to place prints in useful places right away. Knowing the state of the flag by itself tells us almost nothing, so it was decided to add another print with information about the element for which the calculation is made. Then we wanted to override some constant values and make an exception for one element. It looks something like this:
And again, we’ll face with building, reproducing conditions, and analyzing. Disclaimer: debugging via prints is not inherently bad. Sometimes it’s the only way to debug something complex, for example, when a bug only occurs in a release build with some optimizations enabled. But today, we’re talking about simple, routine scenarios that most often happen during development.
Breakpoints
We’ve already established that debugging through prints is not very effective, and we need a tool that will make our lives easier. Breakpoints are such a tool! This mechanism is present in almost all development environments, on many platforms and languages. It’s implemented differently in different places, but Apple has provided us with a powerful and flexible breakpoint system. However, while working with different developers, I noticed that in most cases, people use breakpoints just to pause the program – simply to make sure that its execution is going according to the planned scenario. Sometimes people use the debug console and the `po` command, but only when they need to check the state of a variable once. I suggest exploring additional capabilities of the debugger built into our IDE and providing examples of situations where they can be useful.
Conditional breakpoints
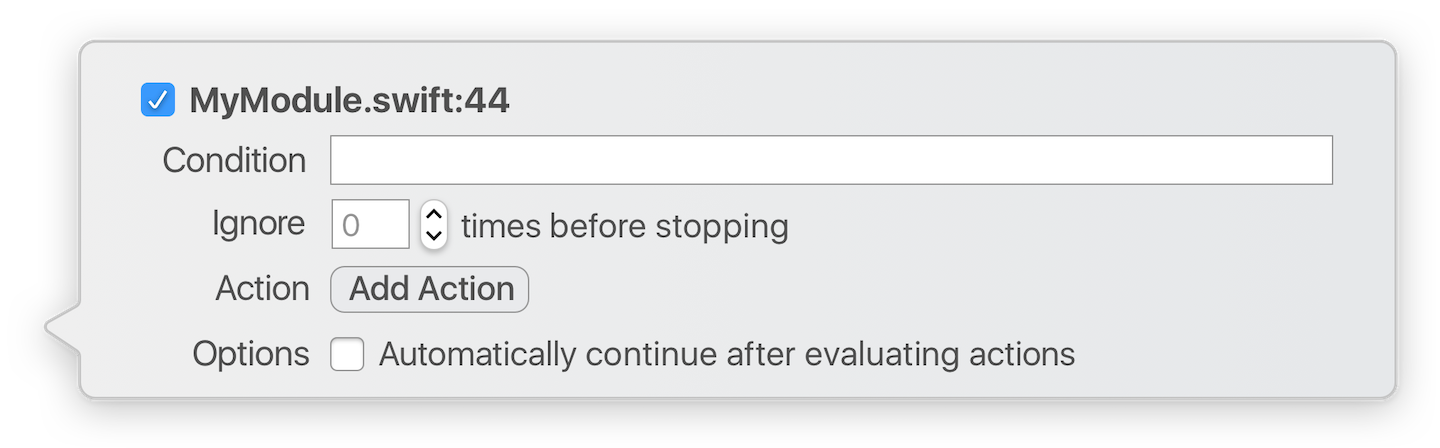
Let’s start with the obvious: conditional breakpoints. Strangely enough, the line that allows you to specify conditions for a breakpoint is always right in front of us, but for some reason, people are surprised by this possibility. For those surprised by the mere presence of such a dialog – you can see it by double-clicking on the breakpoint itself. In the Condition field, you can write any expression that can return a Boolean value, whether it’s a comparison of a variable from the current scope or even the value of a singleton. But be careful – a slow-to-calculate expression can significantly reduce your program’s performance.
Skipping
The next feature, which is also often overlooked by developers, is the ability to ignore a certain number of hits. This feature can come in handy, for example, in recursive functions to see what’s happening at the N-th depth or to check the result of a function for the N-th element of an array. In the example with an array, this approach may be preferable to setting a condition, as it doesn’t require evaluating an expression.
Actions
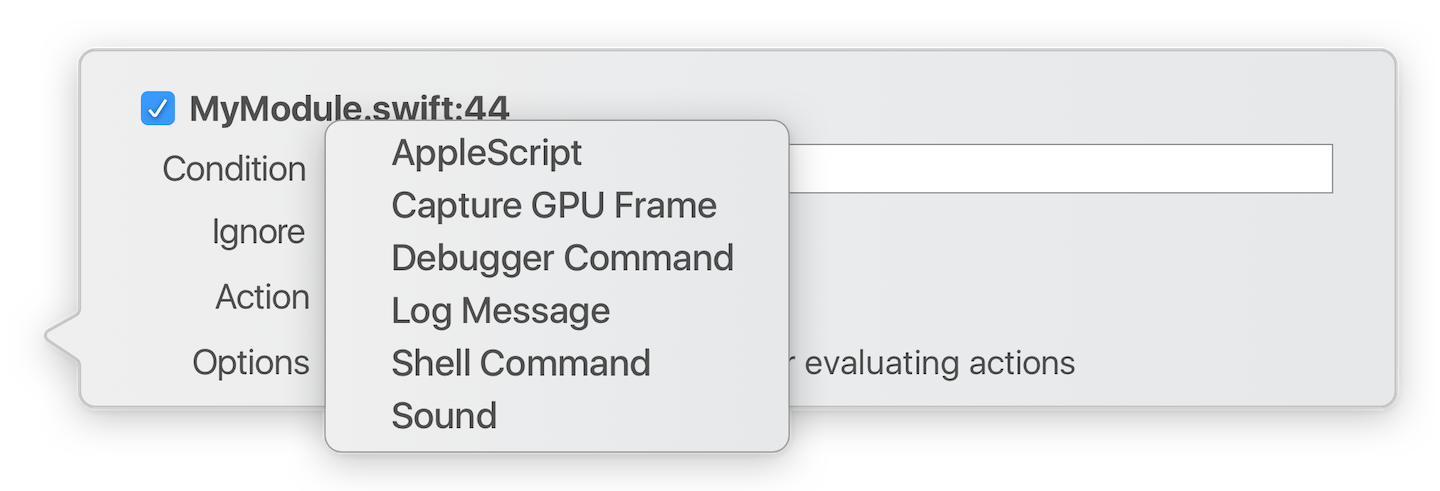
But the most interesting part for us is behind the “Add Action” button. This button allows you to add an additional action that will be triggered when the breakpoint is hit. As you can see, there are 6 types of actions you can use to enhance a breakpoint:
- Apple script. Allows you to run a script in the AppleScript language.
- Capture GPU Frame. This may be required for debugging applications using the Metal engine.
- Debugger command. Allows you to execute a debugger command. We will talk about this later.
- Log message. Allows you to print a text message to the log.
- Shell command. Lets you execute an arbitrary command in the default shell environment, like sh/bash/zsh.
- Sound. Allows you to play a sound through the computer’s speakers where Xcode is running.
I won’t go into detail about the first two types as they are too specific and are unlikely to be useful for most developers. I’ll also skip the last point because there’s not much to say about it. However, it’s worth remembering – it can come in handy when you need to quickly perform an action in your application following a trigger, which could be the sound from a breakpoint set in the right place.
Log messages
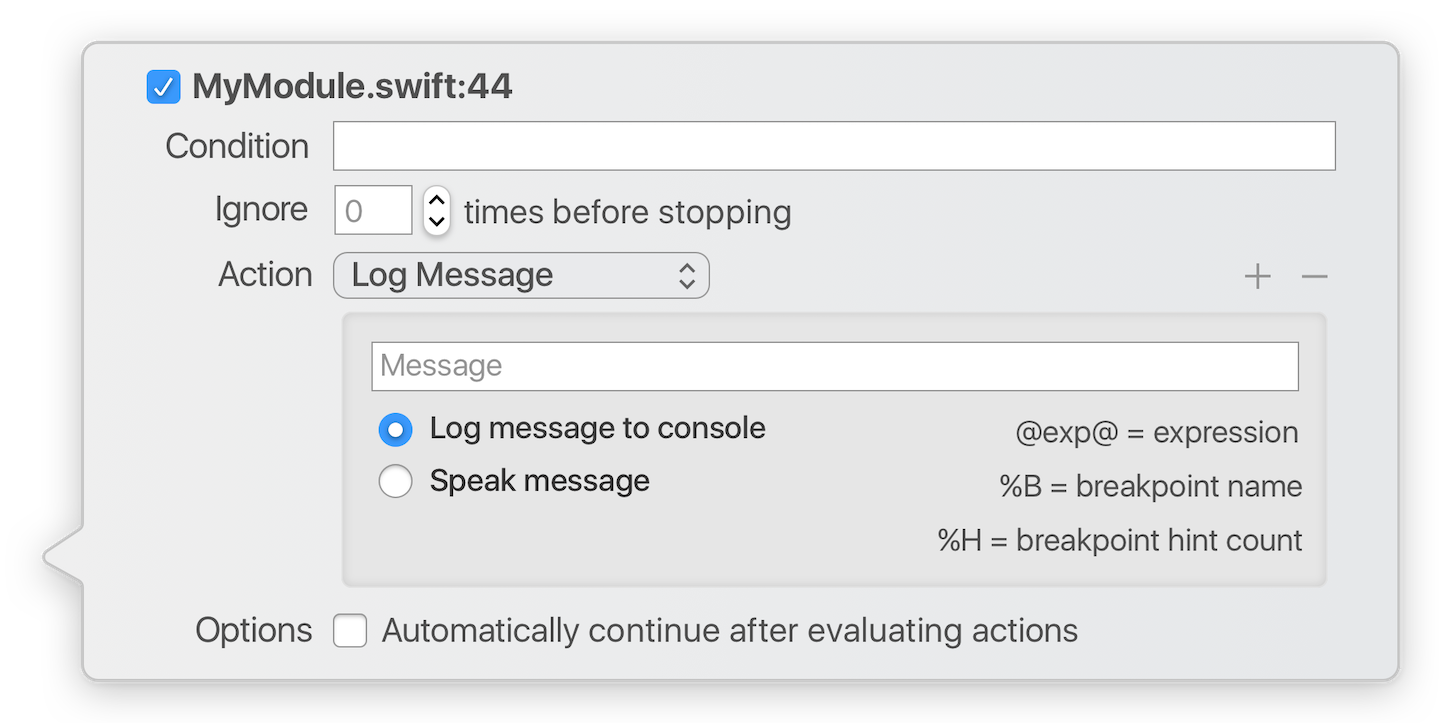
Let’s take a closer look at the “Log message” type of additional action. When you select it, you’ll have an input field for the message format at your disposal. Please note that in this input field, you can use helpful placeholders, two of which allow you to include information about the breakpoint, and one, the most useful one, allows you to insert the result of evaluating an arbitrary expression. This expression can be a variable or any other construct of the programming language you are using. However, this won’t make much sense unless you check the “Automatically continue after evaluating actions” checkbox. It’s this checkbox, when combined with any of the actions, that allows us to save time during debugging. You no longer need to write print(), rebuild the project, and wait for ages. At any moment, without restarting the project, you have access to the debug console’s output of any information about the program’s execution. And for those who are adept at debugging, Apple has provided the ability to play back expressions using the built-in speech synthesizer.
Shell command
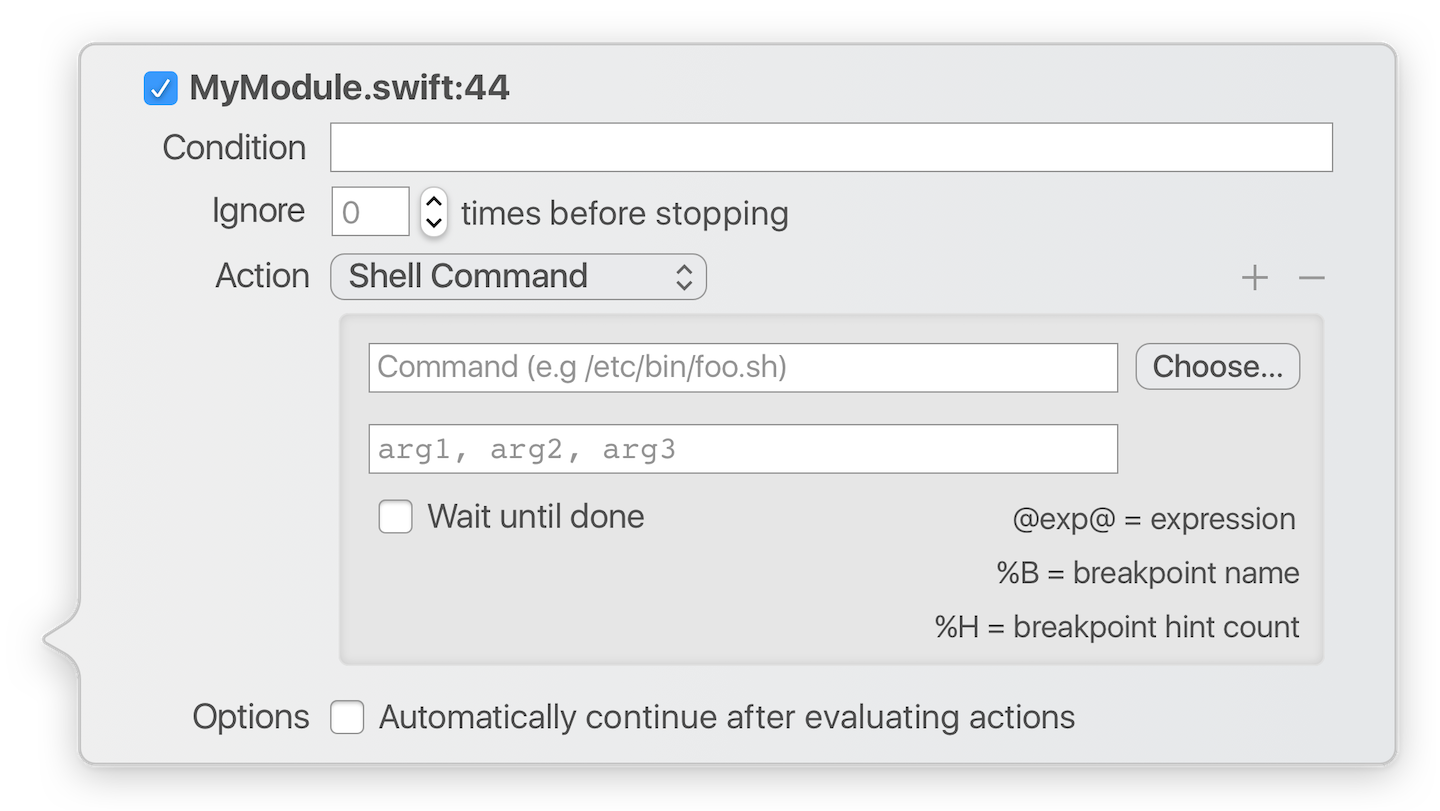
It’s not hard to guess that this action allows you to run an arbitrary command in the standard terminal shell of the OS. Like the “Log message” action, it allows you to evaluate the result of an expression in the current context and use it as arguments for the command call. What could this be useful for? There are plenty of examples. In real life: throttling requests through Charles. I needed to slow down requests from a specific point, while keeping the connection fully functional the rest of the time. I didn’t have time to manually enable and disable throttling and perform actions in the simulator. This trick with a breakpoint and the “Shell command” came in very handy. Another time, I needed to modify server information simultaneously with a request to catch a rather strange bug. This type of breakpoint was also useful in that case. Some enthusiasts might even build a setup with an Arduino and an electric shocker to shock themselves whenever unwanted code is triggered. Just kidding. Don’t attempt this in real life.
Debugger command
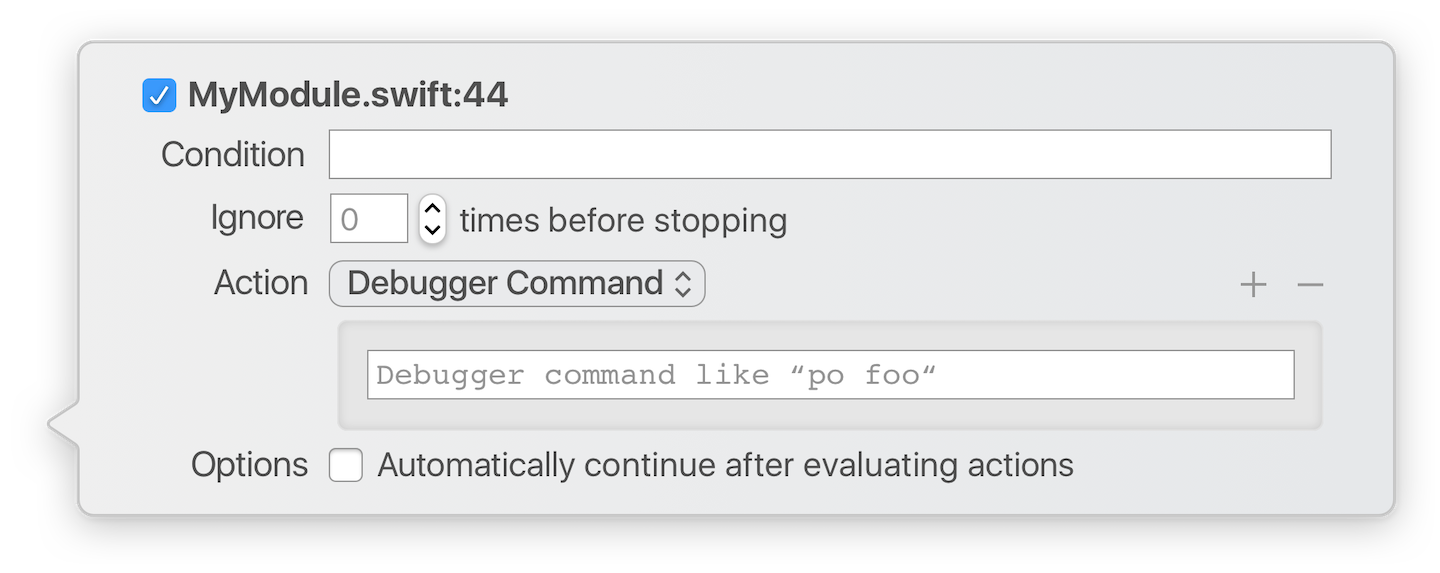
One of the most interesting types of actions, in my opinion, is the “Debugger command.” This action allows you to have a truly unlimited impact on the debugging program. Debugger command is a set of LLDB debugger commands, and LLDB is a debugger used by Apple and Xcode to build programs. The LLDB debugger allows you to connect to a process, interrupt the execution of a program, and manipulate its memory. To do this, the debugger has a multitude of commands, some of which will become the heroes of today’s story. It is thanks to the LLDB debugger that we have the wonderful opportunity to debug a program, including setting breakpoints.
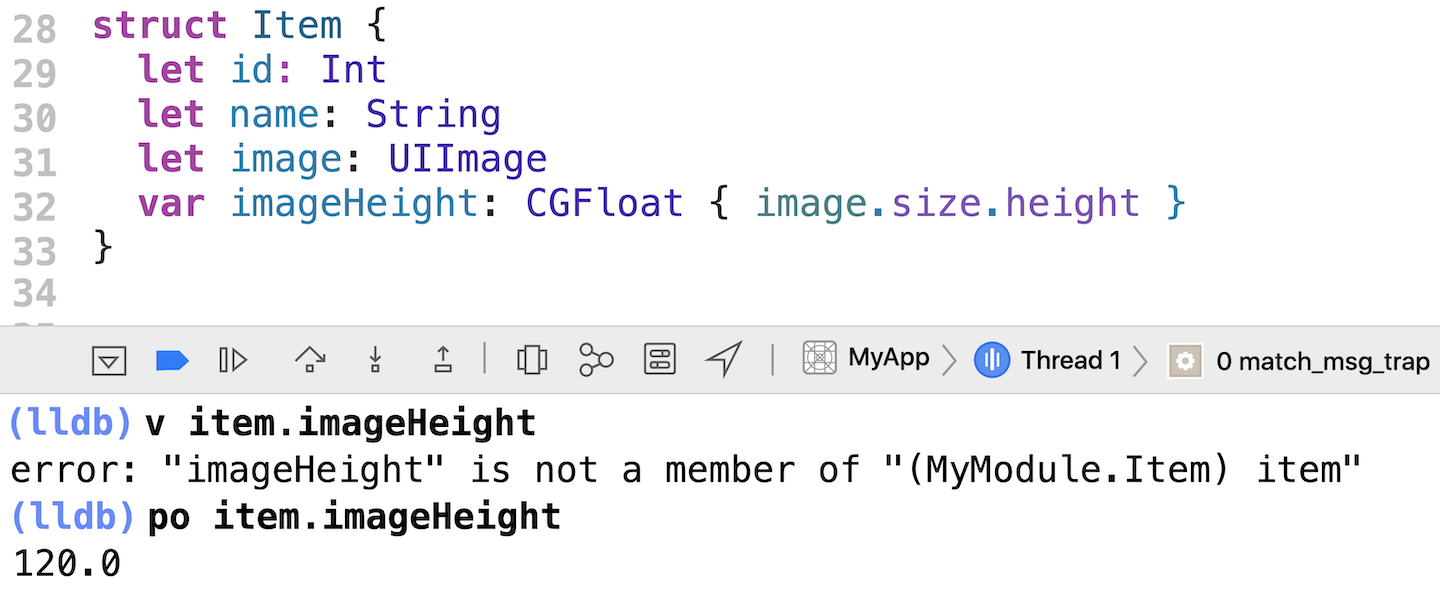
Let’s start with the most well-known command – po. Most of you have probably used this command for debugging many times, but for me, it was a discovery at some point, even though I already had some experience in iOS development at that time. po stands for “print object.” This command allows you to evaluate the expression on the right side of the command and print the result in the console. In this case, the object will be asked for its debugDescription if it’s defined, or simply description if it’s not. There is a parent command for po called print or p, which will similarly evaluate the expression and print the result, but in this case, you will get raw information about the object or scalar type. Both of these commands will compile the entered expression in the current context, which will inevitably slow down the code execution when a breakpoint is hit. Fortunately, in Xcode 10.2, Apple added another debugger command – v, which works significantly faster. It allows you to output the value of a variable from the current scope to the console. However, unlike p and po, it does not compile the expression. The natural limitation imposed by this feature is that console output is only possible for stored properties.
Altering execution flow
Such a combination (breakpoint + debugger command po + automatic continuation) will replace the previously described Log message for us. What else can we do with this combination? For instance, with the help of the debugger, we can skip the execution of several lines of code as if they were commented out. You don’t need to rebuild the program and reproduce the conditions for this. To do this, simply enter
thread jump --by 1to jump forward by one line or
thread jump --line 44to jump, as you might have guessed, to line 44.
☝️
But be careful — you cannot jump between lines completely safely. The reason is that you may jump over the initialization of certain variables, which can cause a crash. It’s further complicated by the fact that Swift is “lazy” in nature, and initialization may occur not where you think. Plus, the compiler inserts additional instructions when building your program, such as memory management, and skipping them can lead to memory leaks at best, and crashes at worst.
Interacting with debugger
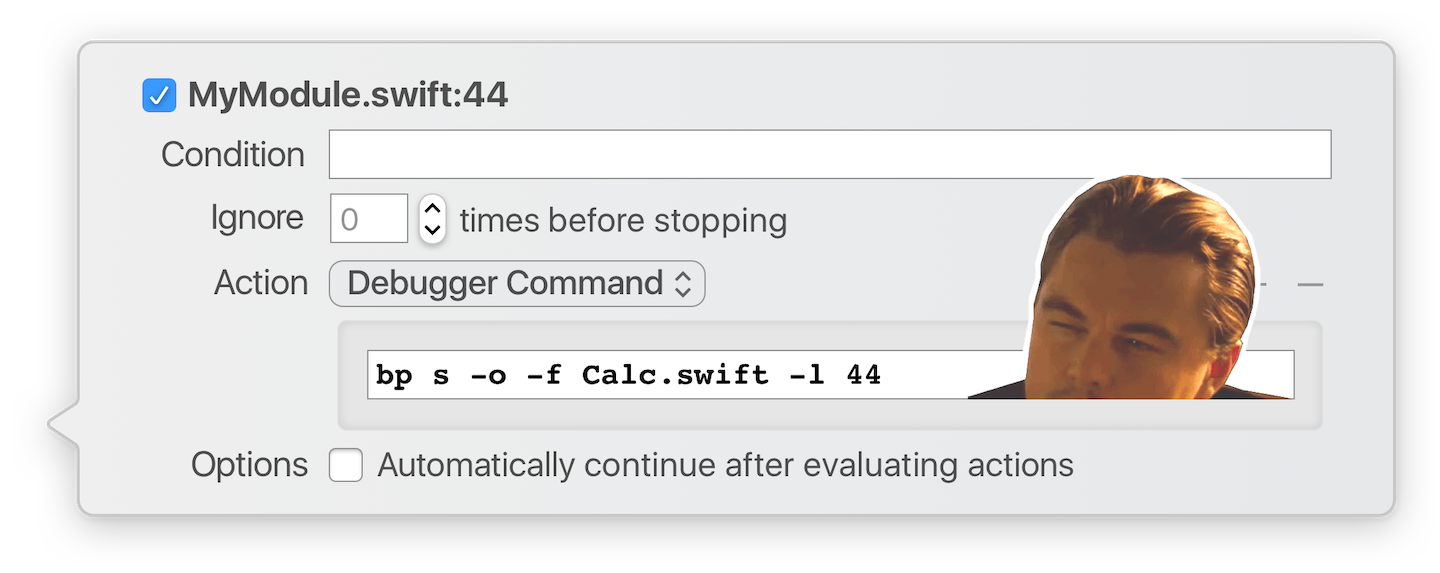
Apart from influencing your program, you can also influence the debugger itself with the help of the debugger. For example, you can set a breakpoint within a breakpoint. You may wonder why this is necessary? There are general-purpose methods that trigger under various conditions. For instance, a function for sending analytics data may be called hundreds of times per second, and you want to catch the specific call triggered by a button press. In this case, you can set a breakpoint on the button press method and add a command to set a breakpoint on an arbitrary line of code in any file. The command bp s -o -f Calc.swift -l 44 is decoded as breakpoint set one-shot on file Calc.swift at line 44. The -o or --one-shot modifier creates a special type of breakpoint that exists only until it’s hit, and then it disappears. Using this straightforward method, we can create interesting breakpoint-setting algorithms for debugging non-trivial bugs.
Other breakpoints types
Are there any other types of breakpoints that we may not know about? Certainly, there are. Xcode allows you to add certain types of breakpoints that are not tied to a specific file and line. In Xcode, there is a Breakpoint Navigator tab that lets you manage existing breakpoints across all project files and create new ones. At the bottom of our IDE window, there’s a plus sign button.
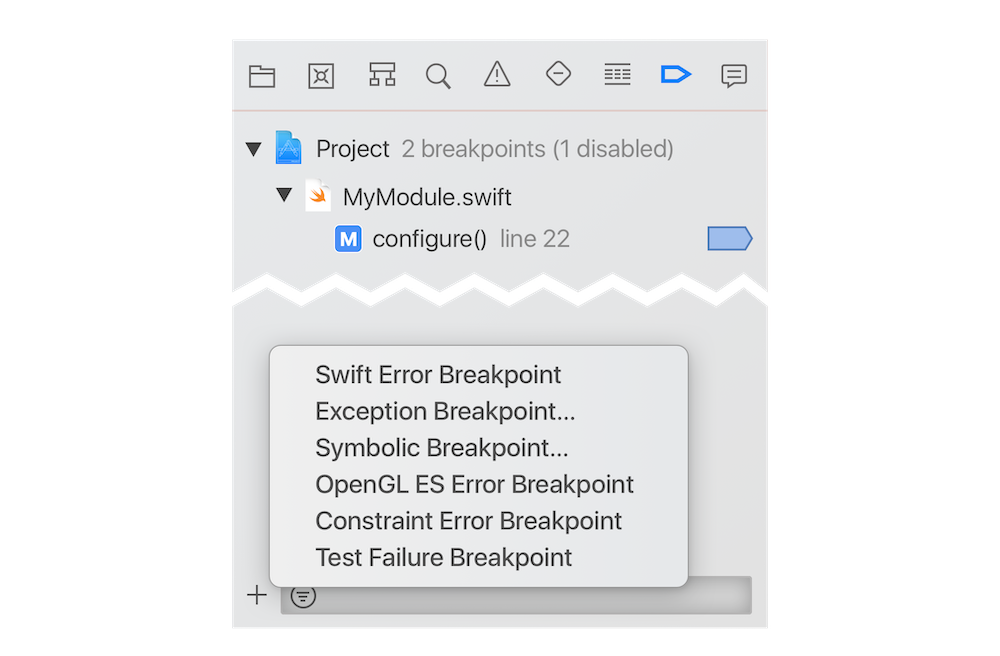
This allows you to use 6 additional types of breakpoints:
- Swift Exception breakpoint – a breakpoint that stops the program when an unhandled throw occurs in Swift code.
- Exception breakpoint – the same as above but for the ObjC world. It may seem like an outdated breakpoint in the modern world, but it’s still relevant. Keep in mind that we still need UIKit, written in ObjC, and we can catch its errors with this type of breakpoint.
- Symbolic breakpoint – allows you to halt the program execution when code associated with a specific identifier, which Apple calls a symbol, is executed. I will explain more about symbols shortly.
- OpenGL ES Error breakpoint – a breakpoint that stops the program when an OpenGL error occurs during the development of relevant applications.
- Constraint Error breakpoint – obviously, it will pause your program when an auto-layout error occurs.
- Test Failure breakpoint – can be helpful in debugging tests.
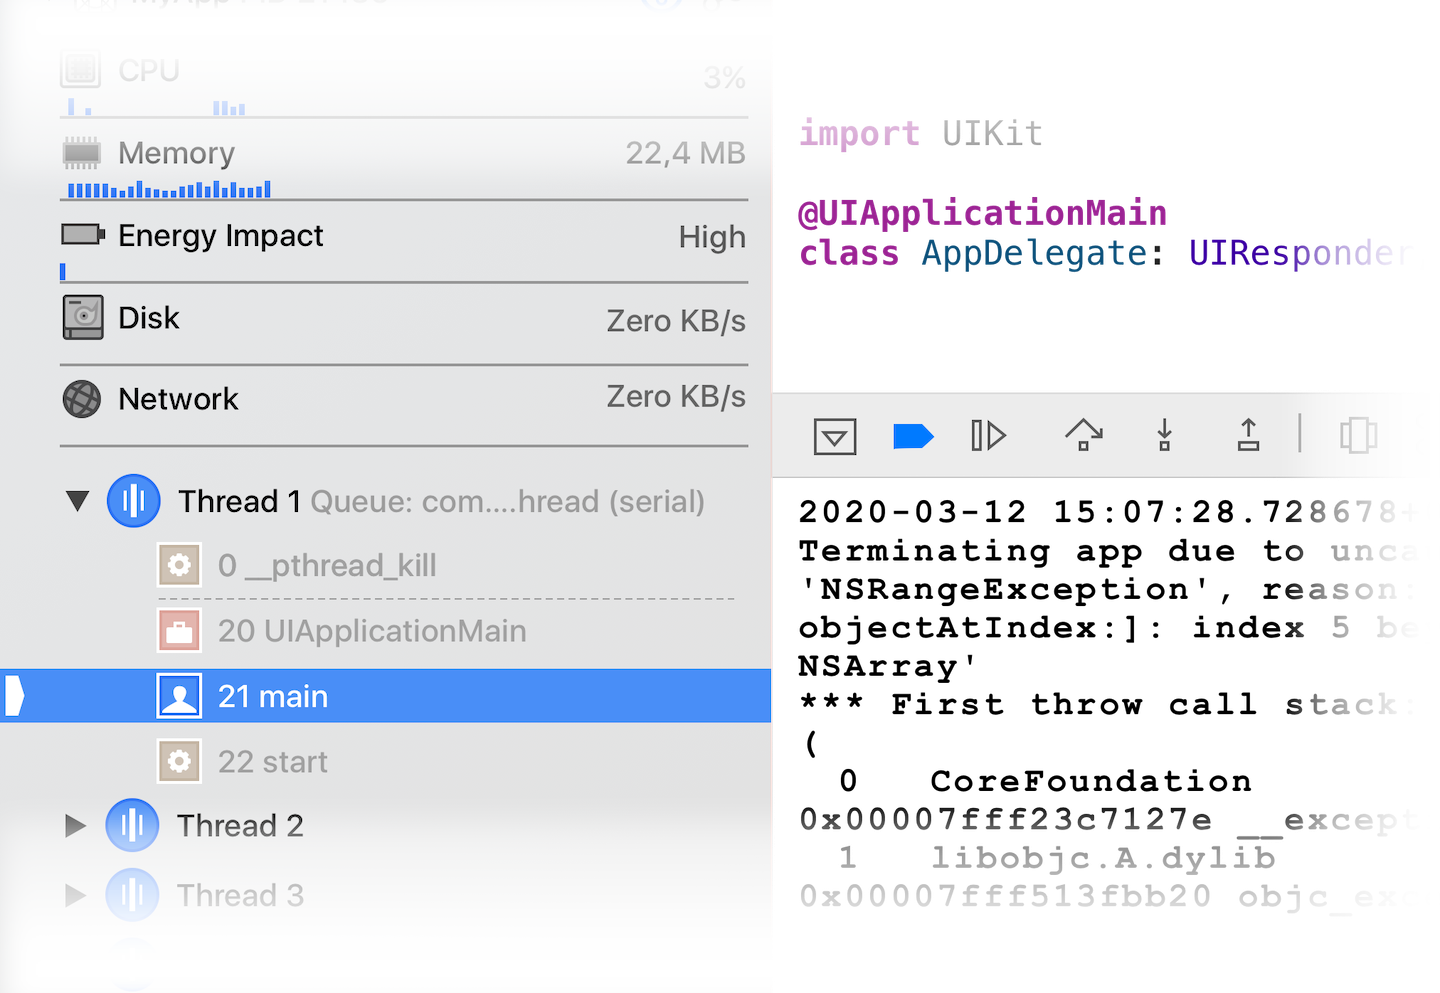
Since it’s not possible to cover all types of breakpoints in this session, I will focus on the most commonly used ones. In my experience, I always use the Exception breakpoint. Quite often during program development, I encounter caught system exceptions that can be challenging to debug due to the uninformative call stack. I believe you’ve encountered such an error at least once:
Exception breakpoint
To make the call stack more informative, you can add an Exception breakpoint. It allows you to stop the program right at the moment an exception is thrown and track the chain of events that led to such a result. By default, an unhandled exception will cause a crash in the application, and in the call stack, you won’t see anything useful because the exception will propagate up the call stack, losing all information about where it was thrown. The Exception breakpoint allows you to halt the program when the exception is thrown, and using familiar methods, you can gather much more information about the issue by inspecting the call stack and variable values, if necessary. I consider this type of breakpoint very useful and use it as a default on all projects.
In Xcode, there is a convenient mechanism that allows you to specify the breakpoint’s level and store it at three levels:
- Project.
- Workspace.
- User.
Simply right-click on the breakpoint and select “Move breakpoint.” When moved to the user level, the breakpoint will be available in all projects you open in your Xcode.
Symbolic Breakpoint
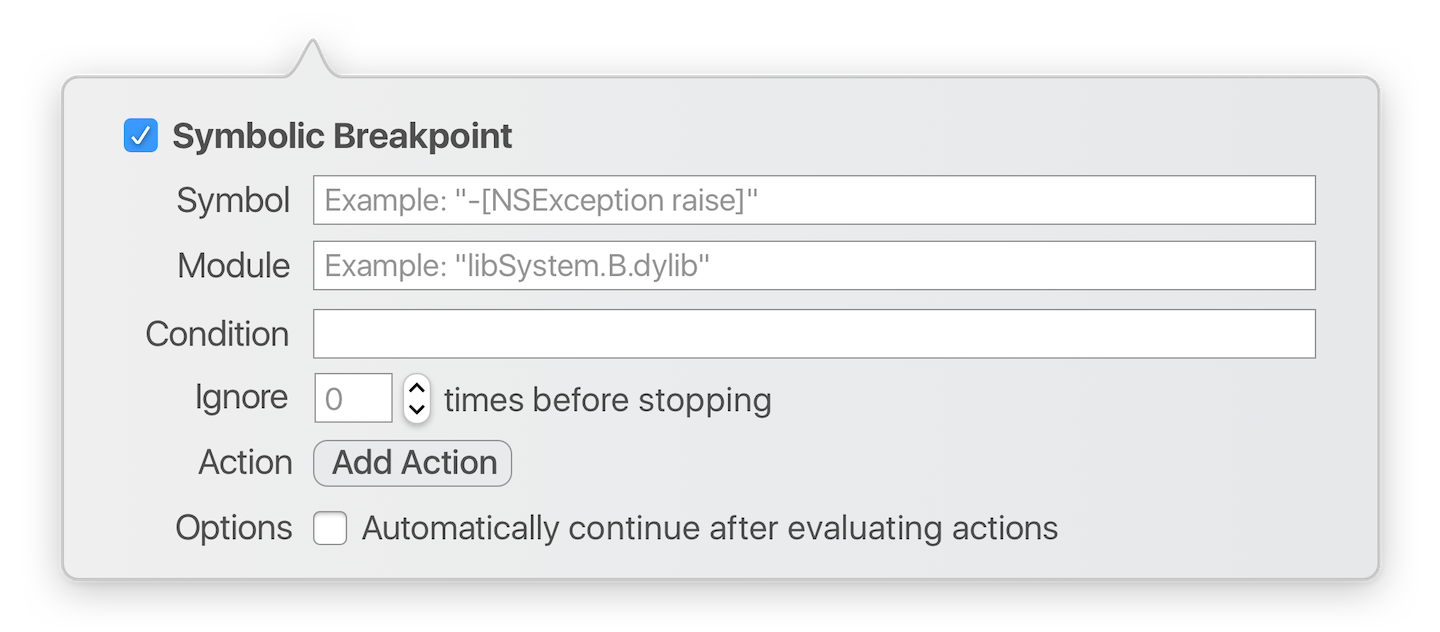
The second most commonly used type of breakpoints is the Symbolic Breakpoint. As mentioned earlier, this breakpoint allows you to halt the program’s execution when code associated with a symbol is executed, and I promised to explain more about symbols. Symbols are human-readable identifiers associated with specific memory addresses. LLDB can map known symbols to function addresses and vice versa. During each project build, the system creates a special bundle of files in the dSYM format, which stands for Debug Symbols. These files contain something like a table containing method addresses, identifiers including method signatures, file names, offsets, and line numbers. It’s thanks to these files that we can set breakpoints on a file’s line, get a readable call stack, or decode an application’s crash log from the AppStore.
This mechanism allows us to set breakpoints on any class method, knowing only its name. We don’t need to know for sure where the method is declared or whether the source files are available. Let’s look at a real example. You’ve been assigned to a new project, and the first task is to fix strange behavior in the credit card data input form when the focus suddenly jumps to the name input field in the middle of typing. Initially, nothing is clear; there is a lot of code, but the symptoms are evident.
To investigate, you need to understand who and why initiates the focus change. You could spend a long time reading the code, looking for logic in non-obvious class extensions, and when you get tired, create a UITextField subclass, override the becomeFirstResponder() method there, change the implementations, and set a breakpoint there. Or you can create a symbolic breakpoint -[UITextField becomeFirstResponder] in 10 seconds, and the program will stop when the focus changes. By tracing the backtrace, we can easily reconstruct the sequence of events leading to undesired results.
For those who are new to using this type of breakpoint, you might wonder, what is -[UITextField becomeFirstResponder]? This is the Objective-C method signature for setting text in a label. The use of Objective-C is due to the fact that UIKit is written in this language.
A few words for those with little experience in Objective-C. The minus sign denotes that we are interested in an instance method, not a class method. Then, in square brackets, the class name is written, followed by the method name, and a colon indicates that this method accepts a parameter.
You may argue that the example is far-fetched. I agree—good code wouldn’t have ten places for setting the label text, but my goal is to show how it can work. Let’s consider a more realistic example. Suppose, for debugging purposes, we need to print the sequence of view controllers appearing. We add a breakpoint with the symbol -[UIViewController viewDidAppear:], specify an additional action po NSStringFromClass([instance class]), and, of course, don’t forget to check “Automatically continue after evaluating actions.”
Once again, we have to use Objective-C, even in the additional command, because we are in its context. As for Swift, symbols are written as ClassName.methodName(param:). Specifying parameters is not mandatory; LLDB will try to resolve ambiguity if there are methods with the same name but different parameters.
Search for symbols
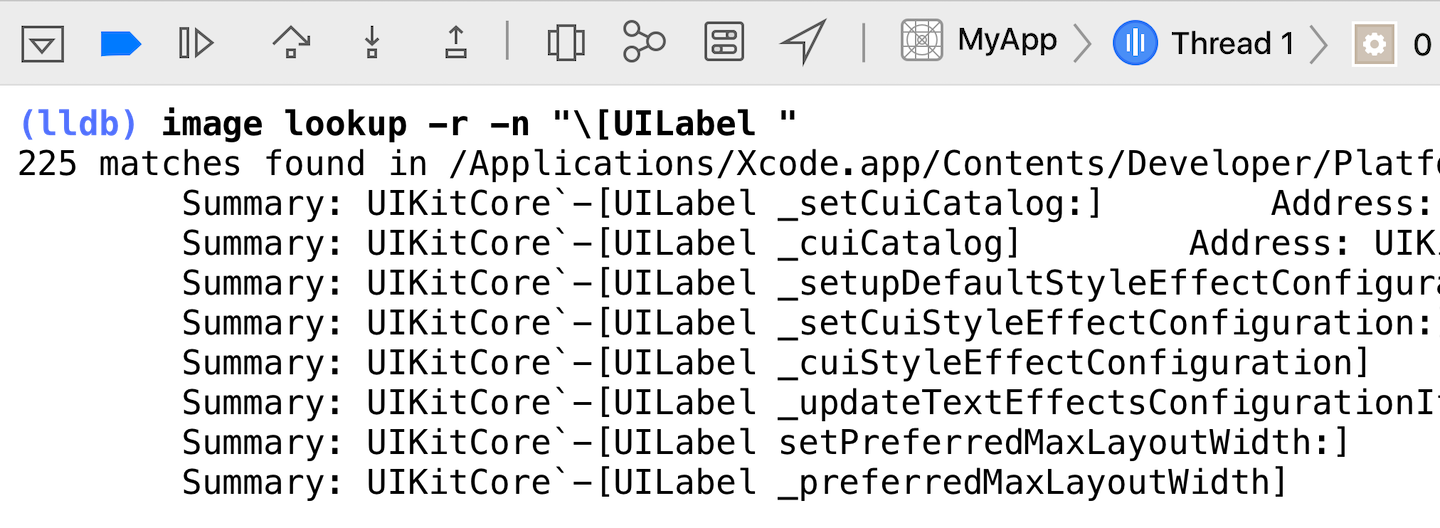
When talking about symbolic breakpoints, I can’t skip mentioning the ability to search for symbols. By stopping the program in any way, whether through a breakpoint or simply by clicking the pause button, you can use the command
image lookup -r -nto find the symbols you’re interested in within your program and all loaded libraries. This truly empowers you to become a debugging deity, as you have the ability to search for symbols everywhere, such as in UIKit, search for private methods, halt and explore the inner workings of system libraries. I hope I’ve convinced you of the power of this method, as it can help you save a lot of time.
Here, variables in the current frame that are available for debugging will be listed. In large projects, calculating the available variables and their types may take some time, so sometimes you need to wait a few (dozens?) of seconds before the variables become available for manipulation. A pleasant bonus is the ability to “look inside” Objective-C objects: the Variables View functionality allows you to see the private variables of these objects. Right-clicking on a variable doesn’t offer too many options – you can change the values of scalar variables and, of course, add watchpoints.
Of course, you can also set a watchpoint using the LLDB command: watchpoint set variable variable_name, or using the command abbreviation feature in LLDB, simply: w s v variable_name. However, remember that the variable must be visible to the debugger, meaning it should be in the current frame. In addition to setting a watchpoint on a variable, you can also set a watchpoint on a memory address:
watchpoint set expression — 0x0d78ab5ea8. In both cases, the program will break when the contents of the monitored memory address change. You can view the set watchpoints with the command
watchpoint listor in the Debugger navigator. Since all watchpoints ultimately monitor a memory address, they become irrelevant after a restart and are not saved between application restarts. Even if you set a watchpoint on a variable change, underneath, the LLDB mechanism calculates its address and sets a watchpoint on that address.
Affecting app state
We are about to wrap it up. The last thing I wanted to cover in this article is influencing the application’s state from LLDB. Up to this point, I’ve only talked about changing the state of a system object when stopping at a breakpoint. But what if we need to pause the program at an arbitrary moment? Clicking the pause icon pauses the program, but instead of the familiar code, we see assembly code. So, how do we access an arbitrary object and perform clever manipulations with it?
Memory graph
Most iOS developers start using this tool from their first months of work. For those who have never used it, let me explain. The Memory Graph allows you to create a memory dump of the program and display all instances of objects currently in memory in the form of a list and a graph. Often, this tool is used to detect object leaks and analyze the relationships that led to such results. But today, we only need this tool for the ability to pause the program at any time, find the required object, and discover its address. But what can we do with this seemingly useless information?
In fact, anything you want. Here, the power of ObjC comes to our rescue. We can write
[0x7fafffa54a5 setValue:[UIColor redColor] forKey:@"switchedOffColor"]- and we have already changed the color of the turned-off lamp to red using the standard NSObject methods available out of the box. But what if these methods are not enough, and we need to “pull” our own levers? It’s simple – we can use casting:
[(MyLamp *)0x7fafffa54a5 powerOff]. Using techniques like this, you can influence any services, managers, and view models of your application at any time.
We can save the value of this address in a variable for convenience:
(MyLamp *)$lamp = 0x7fafffa54a5. It’s important that the variable name starts with a dollar sign. This variable will exist until the program is completely stopped, meaning you can use it not only in the current debugging session but also in the next interruption of the program within a single run.
Objective-C provides truly wide possibilities to hack the current state and bypass many limitations. But what about classes that are only available in Swift? Of course, when attempting to cast a Swift class in an ObjC context, nothing will happen. Fortunately, Swift has a similar mechanism. More precisely, a function with the name unsafeBitCast(_:to:). We are allowed to use it with an address:
unsafeBitCast(0x7fafffa54a5, to: MySwiftLamp.self)and obtain an instance of the MySwiftLamp class by the address. Remember, its use is unsafe, as implied by its name, and it should be used very carefully in the application’s code. However, when you consciously need to use this function, you will be experienced enough to handle such warnings.
View Hierarchy
Next to the Debug Memory Graph tool, there is another equally useful tool called View Hierarchy. It allows you to quickly find the necessary view, view its properties and layout, and inspect active and inactive constraints. Starting with iOS 11, this tool has learned to display ViewControllers in the hierarchy, making it easier to find the desired view. An important feature here is the ability to filter by name and toggle the display of views hidden off-screen. I also noticed that not many people use the control panel at the bottom of the visual View display window.
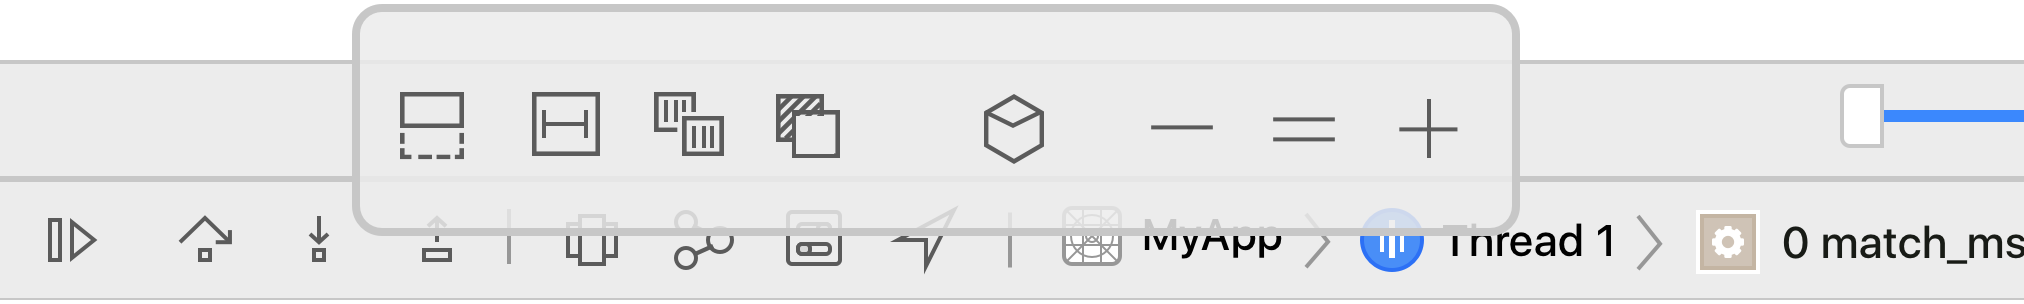
Furthermore, apart from the ability to adjust the depth of the hierarchy view, it allows specifying “enable displaying clipped content” and “enable displaying constraints.” Be sure to experiment with all these tools; I’m sure you’ll find some of them useful for your purposes.
However, within the scope of this story, we only need the ability to locate the desired View and find its address. Then, we proceed as follows:
po unsafeBitCast(0x7fafffa54a5, to: UIView.self). But in this case, we’ll encounter an error because we are currently in the context of ObjectiveC and cannot use po with Swift code. We are forced to use the “expression” command or simply e with the specified language:
e -l Swift -- unsafeBitCast(0x7fafffa54a5, to: UIView.self). But even here, our attempts will not be successful, and we will receive an error error:
This happens because of Swift’s modular nature. To successfully execute the operation, we need to import the UIKit module:
e -l Swift -- import UIKit, and after that, we will finally achieve the result:
e -l Swift -- unsafeBitCast(0x7fafffa54a5, to: UIView.self). Hooray! We have obtained the description in the console. Now let’s try to change, for example, the background color. First, let’s save the View in a variable to make it easier to access. Just like in the case of ObjectiveC, when creating a variable in the LLDB context, its name should start with a dollar sign:
e -l Swift -- let $view = unsafeBitCast(0x7fafffa54a5, to: UIView.self). Then we can apply the necessary changes:
e -l Swift -- $view.backgroundColor = .red. To see the changes, you need to continue the program execution. But there is a way to see the changes without that, while in the “pause” mode.
The thing is, we don’t see the changes not because the application is paused, but because all UIView changes accumulate in a CALayer transaction and are applied only at the end of the current RunLoop “rotation” using the CATrasaction.flush() call. When the application is paused for debugging, the operating system is still alive, and you can switch to another application. The operating system still queries the UI state of your application and redraws your application several dozen times per second, only the RunLoop is paused, CATrasaction.flush is not called, and the changes are not applied.
So, it’s sufficient to manually make the call
e -l Swift -- CATrasaction.flush(), and we will see the changes.
It’s time to wrap this up. I hope these examples will make life easier for someone, save time and nerves. Bookmark this and the next time you spend more than 15 minutes searching and debugging a bug, take a look at this article – maybe one of the tricks will be useful to you.